More About Nyquist
If you've read the other two digital audio pages and still find the Nyquist Theorem hard to understand, here's another way of looking at it. It isn't a proof, just an example of what happens when a wave gets sampled.
First, a little background. The picture below shows two sine waves with different frequencies and a third wave obtained by adding the first two together. The third wave increases and decreases in amplitude as the two sine waves drift in and out of phase, as indicated by the green (in-phase) and orange (out-of-phase) lines in the picture.
The third wave is sometimes called a beat note because of the way its changing amplitude makes it throb or beat. We'll be seeing more of the beat note later on.
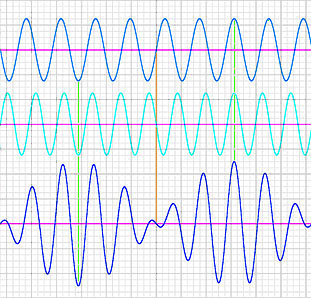
I've chosen two sine waves with frequencies 10% lower and 10% higher than a third frequency, which I'll set to the Nyquist frequency. If the sampling frequency is 40 kHz, the Nyquist frequency is 20 kHz and the frequencies of my two sine waves are 18 kHz and 22 kHz.
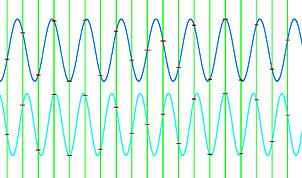
Let's see what happens when the sine waves are sampled. As before, the green lines represent the sample times and the small red marks represent the sample values.
The next picture shows the result of the sample-and-hold operation. If the stepped lines look similar, that's not a coincidence: I chose the frequencies of my two sine waves to be aliases of each other. Figuratively speaking, each is the image of the other, as reflected or "mirrored" across the Nyquist frequency.
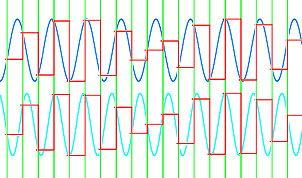
The sampling process always produces additional frequencies. Frequencies below the Nyquist frequency generate aliases above it, and vice versa. Because each of my two sine waves is the alias of the other, sampling either one gives the same result.
(The fact that frequencies above the Nyquist frequency generate aliases below it is the reason digital audio systems need an anti-aliasing filter, which removes all frequencies above the Nyquist frequency before the audio gets sampled.)
The next picture shows how the sample-and-hold values match the beat note shown in the first figure, which is the sum of the two sine waves.
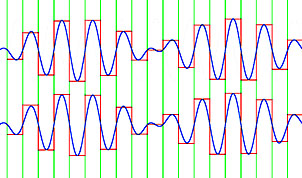
The reconstruction filter is a low-pass filter with a sharp cutoff. In operation, it eliminates all frequencies above the Nyquist frequency, such as the higher of my two sine waves. That's another way of describing the process shown in my page about the reconstruction filter. The sampled values in that example make a beat note because of the alias frequency generated by the sampling. The reconstruction filter removes the alias, restoring the original signal.
Copyright © 2008 Allen Watson III